Market analysis is an essential tool for food companies looking to better understand their business environment and uncover new opportunities. Three key metrics play a crucial role in this process: Total Addressable Market (TAM), Serviceable Available Market (SAM), and Serviceable Obtainable Market (SOM). These metrics help food companies gain a clearer view of market size and potential, allowing them to manage resources more efficiently and make more informed decisions about where to focus their efforts.
Defining TAM, SAM, and SOM in the Food Industry
To begin, it is important to define these metrics clearly and explain their relevance to the food industry.
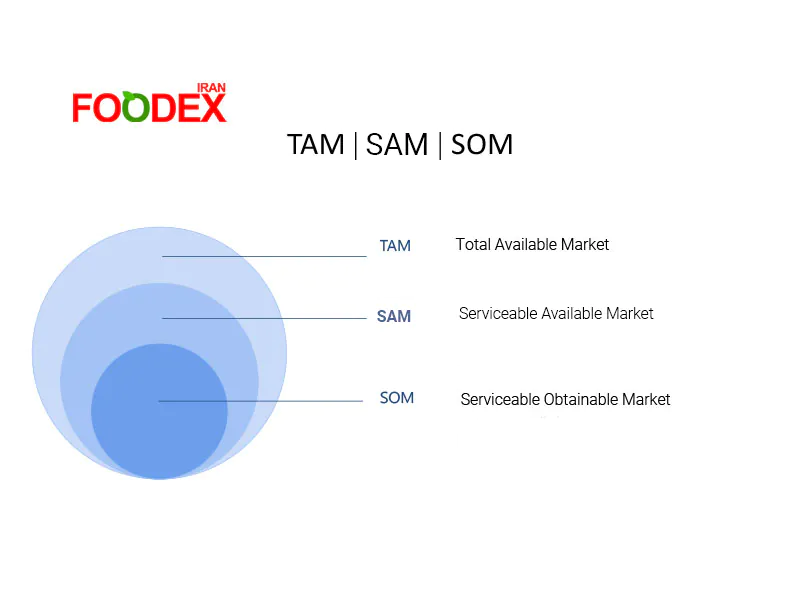
TAM: Total Addressable Market
TAM represents the total demand for a product in the entire market without any constraints. It reflects the largest possible market share a company could capture if there were no barriers. This metric helps businesses understand the overall market opportunity on a global scale.
Example: If you manufacture organic food products, your TAM would be the total value of the global organic food market, encompassing all potential consumers interested in organic products.
SAM: Serviceable Available Market
SAM is a subset of TAM and reflects the portion of the market that a company can effectively target, considering its resources, competitive positioning, and product fit. It allows businesses to focus on market segments where they can realistically compete.
Example: A producer of organic goods selling only in Iran would define SAM as the segment of Iranian consumers who are health-conscious and likely to buy organic products.
SOM: Serviceable Obtainable Market
SOM is an even more refined measure. It represents the portion of SAM that a company can realistically reach and serve with its current resources. This metric indicates the actual market share a company can capture in the short to medium term.
Example: An Iranian organic food producer supplying only to major cities would calculate SOM by focusing on regions currently served and consumers interested in organic products in those areas.
The Importance of TAM, SAM, and SOM in Strategic Decision-Making
These metrics are essential because they enable companies to segment the market with precision, making decisions based on realistic assessments of what is achievable. In the competitive food industry, understanding where to allocate resources is crucial.
Why are these metrics important?
In a highly competitive environment, TAM, SAM, and SOM provide insight into:
The overall size of the market.
The most suitable target market.
The share of the market that can realistically be captured.
By analyzing these factors, food companies can identify real and potential opportunities, allocate resources efficiently, and prioritize their strategic goals.
Case Study: Food Tech Startup
A food technology startup specializing in gluten-free products used TAM, SAM, and SOM to understand its market. First, it calculated the TAM for gluten-free products globally. Then, it refined this by calculating SAM based on the Iranian market. Finally, SOM was determined by focusing on major cities and health-conscious consumers. This approach helped the startup fine-tune its market entry and growth strategy.
Market Research for Food Products
A critical aspect of market analysis is conducting thorough research to gather data necessary for accurately calculating TAM, SAM, and SOM.
How do you calculate TAM, SAM, and SOM?
To calculate these metrics, companies should:
Identify TAM: This involves calculating the total market size for their products using global data and reports.
Example: Estimating the global market size for organic products based on data from sources like Statista or Euromonitor.
Estimate SAM: Narrow the focus to relevant market segments based on competition and demand analysis.
Example: Companies not focused on regional markets should direct their efforts toward SAM by targeting appropriate audiences.
Define SOM: After identifying SAM, calculate what share of the target market can realistically be captured with existing resources and strategies.
Example: A local food company with limited resources must analyze what share of the market they can currently control.
Market Research Tools and Resources
Effective market research can be supported by:
Market Reports: Sources like Euromonitor and Nielsen offer a global view of markets.
Online Databases: Platforms such as Statista and Mintel provide accurate market insights.
Local and In-House Research: Essential for understanding local markets and analyzing competition more frequently.
Issues and Challenges in Food Industry Market Analysis
Market analysis can be challenging due to various barriers. This section addresses common difficulties faced by companies when analyzing their markets.
Common Mistakes in Estimating TAM, SAM, and SOM
Overestimating TAM: Many companies fall into the trap of imagining a larger market than realistically exists, often overlooking entry barriers or competitive landscapes.
For example, a company may miscalculate global demand for its product by failing to consider local regulations or competition.
Ignoring Competition: Underestimating competition can lead to overly optimistic estimates for SAM and SOM.
Avoiding Market Saturation
Entering saturated markets is a significant challenge. Companies must conduct thorough market and competitive analysis before making decisions.
Final Words
Food companies can effectively identify and manage their target markets by utilizing metrics like TAM, SAM, and SOM. These tools provide strategic insights through objective data and accurate analysis, enabling companies to optimize resource management and gain a competitive market advantage.
Sources
Euromonitor International. (2021). Global Market Trends and Analysis in the Food Industry. www.euromonitor.com
Nielsen. (2021). Food and Beverage Industry Report: Understanding TAM, TOM, and SOM. www.nielsen.com
Statista. (2021). Global Organic Food Market Overview. www.statista.com
Ehsan Allahverdi
Executive Manager of Foodex Iran
Marketing Consultant for Leading Food & Beverage Brands
website | linkedin


