Food and our dietary choices play a vital role in our health, energy levels, and overall quality of life. We all seek the best ways to nourish ourselves and our families, yet we can sometimes become lost amidst the vast amount of nutritional information and advice available. How can we ensure our bodies receive all the necessary nutrients adequately? How can we structure our daily meals simply, yet ensure they are balanced and healthy?
To address this need, various food guides have been developed over time by health experts and organizations. One of the most current, practical, and visually intuitive of these guides is “MyPlate”, developed by the United States Department of Agriculture (USDA), which has become a globally recognized tool for healthy eating education. This simple guide helps us ascertain the balance and variety of different food groups in our meals with just a glance at our plate.
But what exactly is MyPlate? How did it come into being, and what are its key messages? Importantly, how do the dietary patterns of Iranians compare to this global guideline? At Foodex Iran, relying on our field research, we have taken a deep look into this topic.
In this comprehensive article from the Foodex journal, we aim to familiarize you with all aspects of “MyPlate” – from its history and rationale to a detailed introduction of the five main food groups and its core principles. Subsequently, by presenting the unique findings of Foodex research, we will paint a realistic picture of the “Iranian food plate,” compare it with the ideal model, and examine the resulting challenges and opportunities, both for the health of Iranian families and for dedicated stakeholders in the country’s food and agriculture industry.
Join us as we learn together how to build healthier and more mindful plates for ourselves and our loved ones.
The Evolution of Food Guides From Pyramid to Plate
Nutritional science is complex, but our need for healthy food is a fundamental daily requirement. Consequently, public health experts and organizations have continuously strived to translate complex nutritional principles into simple, understandable, and practical guidelines for the general public. These guides have evolved over time to align with current scientific knowledge and societal needs. “MyPlate” is the latest link in this evolutionary chain, and understanding its predecessors helps appreciate its value.
1- Early Groupings and the 1992 Food Guide Pyramid
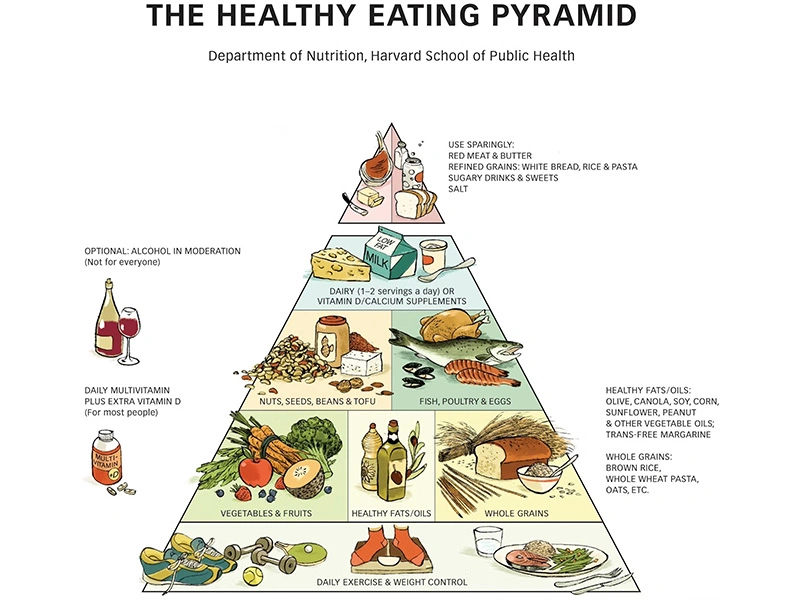
Efforts to group foods and provide consumption recommendations have a long history within the U.S. Department of Agriculture (USDA), evolving from early concepts like the “Basic Seven” to the later “Basic Four” food groups. However, the most widely recognized older guide was the “Food Guide Pyramid”, introduced by the USDA in 1992.
Pyramid Structure This guide was visually represented as a pyramid. Its broad base comprised the Bread, Cereal, Rice, and Pasta group (recommending 6-11 servings daily). The next level up contained the Vegetable group (3-5 servings) and the Fruit group (2-4 servings). Positioned higher were the Milk, Yogurt, and Cheese group (2-3 servings) and the Meat, Poultry, Fish, Dry Beans, Eggs, and Nuts group (2-3 servings). The narrow apex of the pyramid was reserved for Fats, Oils, and Sweets, indicating they should be used sparingly.
Core Message The pyramid aimed to visually convey the principle that one should consume more foods from the base groups (grains) and progressively less from the groups situated towards the top (fats and sweets).
Limitations of the 1992 Pyramid Over time, several criticisms were leveled against this pyramid model, including:
It failed to distinguish between healthier fats (like unsaturated fats) and less healthy ones (saturated and trans fats).
It did not differentiate between whole grains and refined grains, recommending a high intake of all types of grains.
The concept of a “serving size” was often unclear or confusing for the general public to apply accurately.
It completely omitted any guidance regarding the importance of physical activity for overall health.

2- MyPyramid 2005 A Step Towards Personalization (and Complexity!)
In 2005, responding to the criticisms of the 1992 version, the USDA introduced a new guide called “MyPyramid”.
New Visual This iteration featured vertical colored bands running from the apex to the base of the pyramid. Each color represented a different food group, and the width of the band suggested the proportional amount recommended. Additionally, a figure climbing steps alongside the pyramid was included to emphasize the importance of physical activity.
Improvements MyPyramid aimed to offer more personalized recommendations (typically calculated via its website based on an individual’s age, sex, and activity level), placed greater emphasis on variety and moderation, and crucially, incorporated physical activity into the model.
Limitations of MyPyramid Despite these advancements, this guide also faced criticism. The primary issue was that the main pyramid graphic itself was considered too abstract and confusing for many consumers. Without visiting the accompanying website for detailed information, the visual provided little clear guidance on specific food amounts or portion sizes. It effectively lost the intuitive simplicity of its predecessor.
3- The Need for a Simpler Solution Birth of MyPlate
The complexity and lukewarm public reception of MyPyramid underscored the need for a more visually intuitive, simpler, and more direct guide that could be easily applied in everyday life. People needed a tool that simply showed what a healthy plate of food should look like at mealtime. This need paved the way for the introduction of “MyPlate” in 2011 – a guide designed to translate nutritional recommendations into a simple, practical format, directly applicable to our dinner plates.
Introducing MyPlate Fully What is This Plate and What is its Message?
“MyPlate” is the nutritional guide introduced by the U.S. Department of Agriculture (USDA) in 2011, succeeding the MyPyramid model. The primary objective behind MyPlate’s design was to provide a simple, understandable, and practical visual pattern to help people of all ages make healthier food choices and construct balanced meals. Instead of pyramids or complex lists, MyPlate utilizes the familiar image of a place setting to remind us of the recommended proportions of different food groups we should aim for at each meal.
1- The Visual Concept of MyPlate
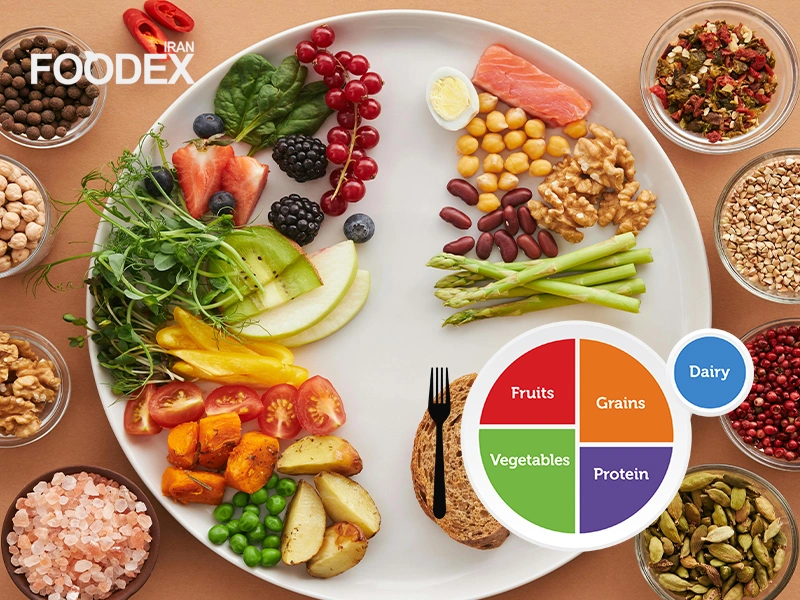
The core MyPlate graphic depicts a round dinner plate divided into four sections, accompanied by a smaller circle to the side representing a cup or glass:
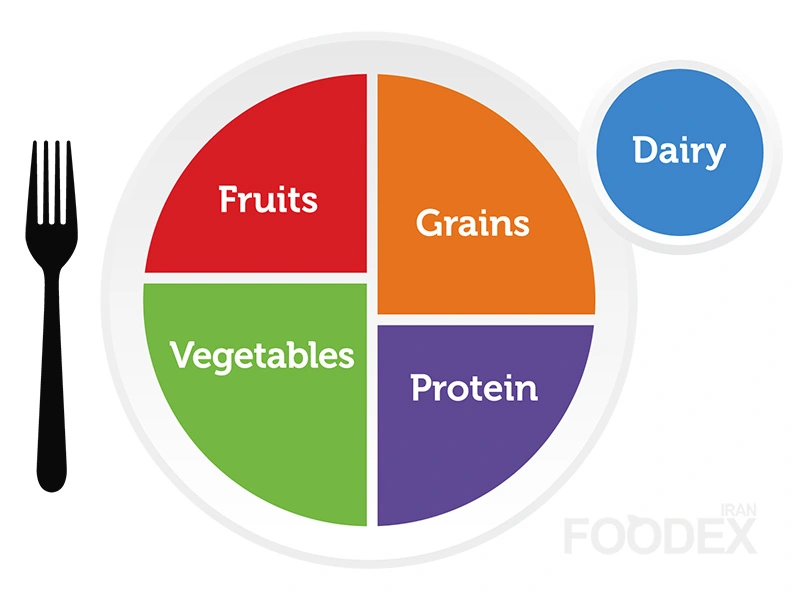
Approximate Proportions: The plate is divided such that:
Half the plate (approx. 50%): Is dedicated to Fruits and Vegetables. This visual emphasis highlights the importance of consuming ample amounts of these two groups in a healthy diet. It’s generally recommended that the vegetable portion be slightly larger than the fruit portion.
The Other Half (approx. 50%): This half is further divided into:
Grains: Occupying slightly more than one-quarter of the plate (approx. 30%).
Protein Foods: Occupying slightly less than one-quarter of the plate (approx. 20%).
Alongside the Plate: The accompanying circle represents the Dairy group (e.g., a glass of milk or a cup of yogurt).
Purpose of the Visual: It is important to understand that this image serves as a visual reminder, not as a strict prescription for the absolute amount of each food at every single meal. Its main purpose is to help individuals build balance and maintain proper proportions among the different food groups throughout the day and across their main meals. The model emphasizes relative amounts.
2- Key Messages and Recommendations of MyPlate
MyPlate is more than just an image; it also promotes a set of simple, actionable messages to help improve eating habits. Some of the most important messages include:
- 1- Make half your plate fruits and vegetables.
- 2- Vary your veggies. (Eat a variety of colors and types)
- 3- Focus on whole fruits. (Choose whole fruits more often than juice)
- 4- Make at least half your grains whole grains.
- 5- Vary your protein routine. (Choose a variety of lean protein foods)
- 6- Move to low-fat or fat-free milk or yogurt.
- 7- Reduce sodium, saturated fat, and added sugars in your diet. (Compare sodium in foods and choose lower numbers)
- 8- Drink water instead of sugary drinks.
- 9- Enjoy your food, but eat less.
- 10- Avoid oversized portions.
These messages provide practical guidance for everyday food choices.
3- Why is this Method Effective?
The simplicity and visual nature are key to MyPlate’s effectiveness. Instead of requiring memorization of serving numbers or complex calorie counting, which can be difficult for many people, MyPlate provides a simple mental image that can be easily applied when preparing or serving a meal. This approach shifts the focus from restriction (“what not to eat”) towards construction (“how to build a balanced plate”) and encourages increased consumption of important food groups like fruits and vegetables.
The Five Food Groups in MyPlate
MyPlate categorizes foods into five main groups based on their primary nutrients and the roles they play in the body. The goal is to consume appropriate proportions from all these groups throughout the day to meet the body’s needs.
1- Vegetables
Vegetables are nutrient powerhouses! They are rich sources of various vitamins (like A, C, K, and Folate), minerals (like Potassium and Magnesium), dietary fiber, and antioxidants. They are low in calories and help promote satiety (feeling full). Remember the key message: Make half your plate fruits and vegetables!
Variety is Key! The USDA further divides vegetables into subgroups to encourage consuming a wider variety:
Dark Green Vegetables: e.g., spinach, broccoli, kale, leafy greens (sabzi khordan in Persian context).
Red & Orange Vegetables: e.g., tomatoes, carrots, sweet potatoes, red bell peppers.
Legumes (Beans and Peas): e.g., kidney beans, lentils, chickpeas (these also count towards the Protein Foods group).
Starchy Vegetables: e.g., potatoes, corn, green peas, lima beans.
Other Vegetables: e.g., zucchini, eggplant, onions, cucumbers, celery, mushrooms.
Aim to include vegetables from various colors and subgroups throughout the week!
2- Fruits
Like vegetables, fruits are excellent sources of vitamins (especially Vitamin C), potassium, dietary fiber, natural sugars, and antioxidants. Their natural sweetness can be a healthy way to satisfy sweet cravings.
Focus on Whole Fruit! MyPlate emphasizes consuming whole fruits more often than fruit juice. Whole fruits provide more fiber and their natural sugars are absorbed more slowly. Fruit juice (even 100% juice) is more concentrated in sugar and lacks significant fiber.
Various Forms: Fruits can be enjoyed fresh, frozen (unsweetened), or dried (like raisins, dates, apricots – be mindful of portion sizes as sugars and calories are concentrated). Canned fruits are best chosen when packed in water or their own juice, rather than heavy syrup.
Examples: Apples, oranges, bananas, berries, melons, grapes, pomegranates, peaches, pears, etc.
3- Grains
Grains are the primary source of energy for the body through carbohydrates. They also provide dietary fiber (especially whole grains), several B vitamins (like thiamin, riboflavin, niacin, and folate), and minerals such as iron, magnesium, and selenium.
Crucial Emphasis on Whole Grains: This is one of MyPlate’s most important messages: Make at least half your grains whole grains.
What are Whole Grains? A whole grain contains the entire grain kernel – the bran, germ, and endosperm. The bran and germ are rich in fiber, vitamins, and minerals.
What are Refined Grains? Refined grains have had the bran and germ removed during milling. This process removes much of the fiber, vitamins, and minerals, leaving mostly the starchy endosperm.
Examples of Whole Grains: Whole-wheat bread, brown rice, oatmeal (whole oats), whole-grain pasta, quinoa, barley, bulgur, whole cornmeal.
Examples of Refined Grains: White bread, white rice, regular pasta (made from white flour), most cakes, cookies, pastries, breakfast cereals made from refined flour.
4- Protein Foods
Proteins function as building blocks for body tissues, including muscles, organs, skin, and hair. They are also essential for making enzymes, hormones, and other body chemicals. Protein foods supply protein, B vitamins, iron, zinc, and magnesium.
Variety and Lean Choices are Key! MyPlate emphasizes choosing a variety of protein foods and selecting leaner options more often.
Diverse Protein Sources Include:
Lean Meats: Choose lean or low-fat cuts of beef, pork, or lamb; trim visible fat. Consume in moderation.
Poultry: Chicken, turkey (preferably skinless).
Seafood: Includes fish (especially fatty fish rich in omega-3s like salmon, sardines, trout) and shellfish (like shrimp). Eating seafood at least twice a week is recommended.
Eggs: A high-quality source of complete protein.
Legumes (Beans, Peas, Lentils): Excellent sources of both protein and dietary fiber (e.g., kidney beans, chickpeas, lentils, split peas).
Nuts and Seeds: Almonds, walnuts, pistachios, hazelnuts, sunflower seeds, pumpkin seeds, sesame seeds. Provide protein and healthy fats (consume in appropriate portions).
Soy Products: Tofu, edamame, tempeh, fortified soy milk.
5- Dairy
The Dairy group is the primary source of dietary calcium, which is vital for building and maintaining strong bones and teeth. Dairy products also provide potassium, protein, and are often fortified with Vitamin D.
Choose Low-Fat or Fat-Free! The main recommendation from MyPlate is to choose low-fat (1%) or fat-free milk, yogurt, cheese, and other dairy products to help reduce intake of saturated fat.
Examples: Milk, yogurt (plain or low-sugar), cheese, cottage cheese. For individuals with lactose intolerance, lactose-free milk or calcium-fortified soy milk (soy beverage) are suitable alternatives within this group. (Note: Cream cheese, cream, and butter are not typically included due to low calcium and high fat content).
Advantages of Using the MyPlate Model
Due to its simple and practical design, the “MyPlate” guide offers several advantages over older or more complex dietary guidelines, making it a popular tool for healthy eating education worldwide. Some of the most significant advantages include:
1- Simplicity and Easy Visual Understanding
MyPlate’s greatest strength is its simplicity and comprehensibility. The familiar image of a plate eliminates the need to memorize complex numbers, serving sizes, or pyramid levels. Anyone can easily grasp the concept of balanced food groups at a glance and try to implement it during their meals. This feature makes it exceptionally easy to use in everyday life.
2- Focus on Proportions and Balance
MyPlate shifts the focus away from meticulous calorie counting or tracking servings towards achieving proportion and balance among different food groups. The model reminds us that no single food group is inherently “bad,” but rather that balanced consumption in appropriate amounts from each group is important. The emphasis on filling half the plate with fruits and vegetables serves as a powerful message for improving common dietary patterns.
3- Encourages Consumption of Key Groups
The visual guide specifically encourages individuals to increase their intake of food groups often under-consumed (like fruits and vegetables) and also prompts healthier choices within other groups (such as opting for whole grains over refined grains and choosing lean and varied protein sources).
4- Flexibility and Adaptability
MyPlate is not a rigid diet plan with prescribed foods; instead, it offers a flexible framework. Individuals can incorporate their favorite foods, traditional and cultural dishes, or options suitable for specific needs (like vegetarian diets) within this framework while adhering to the recommended proportions. This flexibility makes long-term adherence more achievable.
5- Practicality in Daily Life
The plate concept is easily applicable in various situations – whether preparing meals at home, choosing food at a restaurant, or attending social gatherings – without requiring complex calculations. It is also relatively simple to explain to children, aiding in the education of healthy eating habits from a young age.
6- Effective Educational Tool
For nutrition professionals, health educators, and teachers, MyPlate serves as a highly useful and efficient educational tool to convey key healthy eating concepts to the public in a simple and understandable language.
These advantages have established MyPlate as a practical and accessible guide for improving daily food choices for individuals around the globe.

Is MyPlate a Diet Guideline vs Regimen
This important question occupies the minds of many. Is MyPlate a specific “weight loss diet” or a defined daily meal plan that must be followed precisely?
The short answer is no, MyPlate itself is not a diet!
Difference Between Guideline and Regimen The term “diet” often refers to a specific, sometimes restrictive eating plan designed for a particular goal (like rapid weight loss or managing a specific disease), usually involving prescribed food lists, exact quantities, or calorie counting. MyPlate, however, is primarily a visual guideline or framework intended to promote healthy and balanced eating habits over the long term. It doesn’t tell you exactly how many grams of rice or pieces of chicken to eat at each meal; rather, it reminds you of healthy overall proportions on your plate.
Using MyPlate as a Base for a Diet Now, the question is, can the principles of MyPlate be used to design a specific diet? Yes! The power of MyPlate lies in its flexibility. You can use its framework to structure a meal plan for specific objectives. For example:
For Weight Management: By adhering to MyPlate proportions (especially filling half the plate with lower-calorie fruits and vegetables, choosing lean proteins and whole grains), calorie intake can often be naturally controlled, and satiety (feeling full, due to fiber and protein) increased. For effective weight loss, an individual would need to pay close attention to overall portion sizes and make lower-calorie choices within each food group (e.g., baked chicken instead of fried), in addition to following the proportions. Some simplified approaches attempt to adapt MyPlate specifically for weight loss, though they may oversimplify the official guideline.
For Specific Needs: An athlete could use the same pattern but increase their portions of protein and carbohydrates, or a vegetarian could fulfill their protein needs entirely from plant sources (legumes, soy, nuts) within the designated protein section of the plate.
Why Being a Guideline is Advantageous The fact that MyPlate is a guideline rather than a strict diet makes it easier for individuals to adapt it to their lifestyle, cultural food preferences, and personal tastes. This encourages the development of sustainable healthy habits over the long term, instead of following a temporary, restrictive plan.
Role of Nutrition Professionals Despite MyPlate’s simplicity and practicality, relying solely on the visual guide may not be sufficient for specific goals like significant weight loss, managing health conditions such as diabetes or kidney disease, or during specific life stages (pregnancy, lactation). In these cases, it is essential to consult with a Registered Dietitian (RD) or physician. They can provide personalized, detailed meal plans based on scientific principles (which incorporate the MyPlate guidelines) tailored to individual needs and ensuring nutritional adequacy.
So, in summary, MyPlate serves as the general roadmap to health, not the detailed daily travel itinerary!
From Ideal Pattern to the Reality of the Iranian Plate
Now that we are well-acquainted with the principles and food groups of the “MyPlate” guide and understand the characteristics of a healthy, balanced eating pattern, it is time to take a closer look at our own tables. How closely does the typical Iranian way of eating resemble this ideal model in practice? Which food groups do we consume more of, and which ones less?
Fortunately, the Foodex Iran research team conducted a study in June 2023 that provides a clear picture of the average per capita consumption of various food items in the country. In this section, using this valuable data, we will examine Iranian consumption patterns category by category, comparing them with MyPlate recommendations, Iranian Ministry of Health guidelines, and sometimes global averages. This comparison will help us gain a better understanding of the current situation, challenges, and opportunities for improving nutritional patterns within Iran.
1- Grains Bread and Rice Still Predominant
Unsurprisingly, the Grains group, particularly bread and rice, constitutes a large portion of the typical Iranian food plate.
General Consumption Status: Bread, as the staple food, sees very high consumption (with significant daily expenditure noted in some reports). The three primary sources of grains in Iran are bread, rice, and pasta. Foodex research indicates that the average combined annual per capita consumption of rice, grains, and pasta in Iran is approximately twice the global average. This highlights the substantial contribution of this food group to the Iranian diet.
Comparison with Recommendations: The Iranian Ministry of Health sets the desirable annual intake of bread and grains at 155 kg per person. Foodex findings suggest that, quantitatively, Iranians meet this level on average.
The Key Challenge: Type of Grains Consumed: Despite sufficient intake volume, the critical issue lies in the type of grains predominantly consumed. The vast majority are refined grains (lacking bran and germ), such as breads made with white flour and white rice. This directly contrasts with MyPlate’s crucial recommendation to make at least half of all grains consumed whole grains. Whole grains are rich sources of fiber, B vitamins, and minerals, much of which is lost during the refining process.
Interesting Statistics on Rice and Pasta
Rice: According to the research, per capita rice consumption in Iran (approx. 36 kg) is lower than the global average (approx. 44 kg).
Pasta: Pasta consumption in Iran (approx. 6 kg) is significantly lower than the global average (approx. 24 kg), representing about one-quarter of the global figure.
Conclusion for Grains: Although overall grain consumption in Iran is high, the insufficient intake of whole grains represents a major nutritional challenge. This also presents a significant market opportunity for producers of whole grain-based products.
2- Protein Foods Low Variety and Focus on Poultry
The Protein Foods group in the MyPlate guide encompasses a wide array of sources, including lean meat, poultry, fish, seafood, eggs, legumes (beans, peas, lentils), nuts, seeds, and soy products. MyPlate emphasizes the importance of variety in selecting protein sources and preferring leaner options. Let’s examine the consumption patterns for this group in Iran based on Foodex research:
Red Meat: Foodex findings show per capita consumption of red meat in Iran (approx. 9 kg per year) is drastically lower than the global average (approx. 42 kg). As noted in the research, this significant difference is undoubtedly influenced by economic conditions and the high price of red meat.
Poultry: Conversely, per capita poultry consumption in Iran (approx. 24 kg) is considerably higher than the global average (approx. 15 kg), likely indicating its substitution for red meat due to more affordable pricing. (However, recent reports suggesting a decrease in poultry consumption were also noted).
Eggs: Per capita egg consumption (approx. 11 kg) is also lower than the global average (approx. 15 kg).
Fish and Seafood: The situation is more concerning here. Despite geographical access to marine resources, per capita consumption of fish and seafood in Iran (approx. 10 kg) is substantially less than the global average (approx. 22 kg). High prices are cited as one reason for this low intake.
Legumes: Legumes, playing a significant role in traditional Iranian cuisine, still show high consumption. According to the data, per capita legume consumption in Iran (approx. 9 kg) is roughly three times the estimated global average (around 3 kg), although recent price increases may have impacted intake.
Processed Meats (Sausage/Cured): Consumption of these meats is very low in Iran (approx. 3.5 kg) compared to the global average (approx. 16 kg).
Soy: Soy consumption as a plant-based protein source has not yet gained significant traction in Iranian cuisine, with per capita intake (approx. 0.5 kg) being vastly lower than the global average (approx. 9 kg).
Nuts: Interestingly, despite high prices, per capita nut consumption in Iran (approx. 4.2 kg) is higher than the global average (approx. 2.8 kg), reflecting their cultural importance.
Overall Protein Intake Comparison: The Iranian Ministry of Health recommends a desirable total annual intake of 59.5 kg for protein foods (summing red meat, poultry, eggs, soy, and nuts). The Foodex research highlights that the primary focus of Iranians’ protein intake is heavily skewed towards poultry, while other valuable and diverse sources (like fish, sufficient legumes, eggs, and soy) receive less attention than recommended for a varied diet.
Analysis and Conclusion: Therefore, the main challenge regarding the protein section of the Iranian plate is the lack of sufficient variety and an over-reliance on one or two sources (predominantly poultry, alongside relatively high legume and nut intake). This contrasts sharply with MyPlate’s emphasis on obtaining protein from diverse sources to ensure intake of all essential amino acids and other key nutrients (e.g., omega-3s from fish, specific types of iron from red meat and legumes, fiber from legumes). This lack of diversity could have nutritional implications. This situation also presents opportunities for promoting and producing a wider array of protein sources, particularly plant-based and seafood options, within the country.
3- Fruits Consumption Far Below Recommendations
The MyPlate guide places significant emphasis on fruit consumption, recommending it fill nearly one-quarter of the plate (slightly less than vegetables), with a preference for whole fruits over juice. Fruits are rich sources of vitamins (especially Vitamin C), minerals (like potassium), fiber, and important antioxidants. But what does the consumption data reveal for Iran?
Overall Fruit and Juice Consumption: Unfortunately, Foodex Iran’s research shows that the per capita consumption of fruit and fruit juice combined in Iran (totaling approx. 50 kg per year) is drastically lower than the estimated global average (approx. 220 kg). This means Iranians, on average, consume less than a quarter of the global average! A decrease in consumption has been observed in recent years, with rising fruit prices cited as a primary reason.
Fruit Juice Consumption Specifically: Juice consumption alone is also very low in Iran (approx. 7 kg per person annually) compared to the global average (approx. 52 kg). Potential reasons mentioned include cultural consumption habits or issues related to the price and quality of packaged juices.
Comparison with MOH Recommendation: The Iranian Ministry of Health recommends a desirable annual fruit intake of 102.2 kg per person. Foodex research clearly indicates that actual consumption by Iranians falls far short of this recommended level.
Analysis and Implications: This large gap between actual consumption and recommended amounts (from both MyPlate and MOH) is concerning. Insufficient fruit intake can lead to inadequate consumption of essential vitamins, fiber, and antioxidants within the population, potentially increasing the risk of certain chronic diseases in the long run.
Opportunity for Industry and Innovation: This situation, as rightly pointed out in the original Foodex article, creates a significant opportunity for producers in the fruit and processed fruit industry. Developing more diverse products (like high-quality, low-sugar compotes and canned fruits, attractive dried fruits, high-quality natural juices), catering to local tastes, and promoting increased fruit consumption (in various forms) could benefit both public health and create new markets.
4- Vegetables Insufficient Intake Except for Onions and Tomatoes
MyPlate allocates the largest portion of the plate to vegetables (slightly more than fruits) and stresses consuming a wide variety of colorful types to obtain a broad spectrum of vitamins, minerals, fiber, and antioxidants. Vegetables are low in calories and contribute significantly to overall health. How does Iranian consumption stack up?
Overall Vegetable Consumption: Foodex research indicates that total vegetable consumption in Iran is approximately half the global average, with a decline noted in recent years. This means Iranians consume significantly fewer vegetables overall compared to global patterns.
Consumption Details by Type: An interesting aspect of the data is the variation among different vegetables:
Tomatoes: Consumption is near the global average.
Onions: Consumption is approximately double the global average, highlighting their prominent role in Iranian cuisine.
Potatoes: Consumption is about half the global average. (Note: While botanically a starchy vegetable, potatoes sometimes have
specific considerations in dietary guidelines due to their high carbohydrate content).
Other Vegetables: Consumption of other types of vegetables (likely including leafy greens, cruciferous vegetables, squashes, eggplants, carrots, cucumbers, etc.) is significantly lower than the global average.
The Iranian Ministry of Health recommends a desirable annual vegetable intake of 135 kg per person. Foodex research (considering the sum of measured vegetables, potatoes, tomatoes, and onions) showed that Iranians do not meet this recommended level.
Analysis and Implications: These statistics reveal a serious nutritional challenge. Low overall vegetable intake combined with a lack of diversity (heavy reliance on onions and tomatoes, low intake of other colorful and leafy green vegetables) means Iranians may be missing out on the wide array of essential nutrients provided by different vegetable types. This could negatively impact public health in the long term.
Challenge/Opportunity: Promoting the consumption of a wider variety of vegetables and finding ways to incorporate them into daily diets (especially for children) presents a significant cultural and educational challenge. There are also opportunities for producing and marketing diverse fresh or conveniently prepared vegetables (like salads or frozen options).
5- Dairy Consumption Below Recommended Level Except for Yogurt
The Dairy group is represented by the circle alongside the MyPlate graphic and includes milk, yogurt, cheese, milk-based beverages, and calcium-fortified soy milk/yogurt. This group is the primary source of calcium and often Vitamin D (if fortified) for bone health, also providing protein and potassium. MyPlate’s key recommendation is to choose low-fat or fat-free options. Foodex research examined the consumption of four main items in Iran: milk, yogurt, cheese, and doogh (a traditional yogurt drink).
Milk: Per capita milk consumption in Iran (approx. 38 kg per year) is significantly lower than the global average (approx. 61 kg), roughly half. High milk prices are suggested as a likely contributing factor.
Cheese: The situation for cheese is similar, with per capita consumption in Iran (approx. 9 kg) being half the global average (approx. 18 kg).
Yogurt: In contrast to milk and cheese, yogurt appears to hold a better position in the Iranian diet, with consumption reported as higher than the average in other countries (specific global average for yogurt was not provided).
Doogh: This traditional Iranian beverage lacks direct global consumption comparison data. However, an interesting comparison with Turkey was provided: annual per capita consumption is around 30 liters in Turkey versus about 8 liters in Iran.
The Iranian Ministry of Health recommends a desirable annual dairy intake of 91.2 kg (or liters – consistency noted earlier). Foodex research clearly shows that Iranians, on average, consume considerably less dairy than this recommended amount.
Analysis and Implications: Insufficient dairy intake, particularly of milk and cheese, raises concerns about adequate calcium and Vitamin D intake, crucial for bone health, especially among children, adolescents, and the elderly. This highlights the importance of considering other dietary calcium sources or fortified products. The relatively high yogurt consumption is a positive point but doesn’t fully compensate for the low intake of other dairy forms.
Industry Opportunity: This consumption gap presents opportunities for the dairy industry to innovate with more affordable, diverse, fortified (with Vitamin D/Calcium), or appealing products (or alternatives). Promoting low-sodium, non-carbonated doogh as a healthy beverage could also be explored.
6- Oils and Additives High Oil and Salt Consumption
While oils, salt, and sugar are not primary food groups on MyPlate, they are significant dietary components whose intake MyPlate principles generally encourage limiting (unhealthy fats, sodium, added sugars). Foodex research examined the consumption of these items in Iran:
Oil and Butter
Global Comparison: Foodex findings indicate oil and butter consumption in Iran is approximately half the global average.
Domestic Recommendation Comparison: However, the Iranian Ministry of Health’s desirable annual average oil consumption is 27.3 kg per person, and Foodex research shows that Iranian consumption exceeds this recommended level.
These two findings might seem contradictory, possibly due to different calculation methods or inclusion of hidden fats in global averages. The key takeaway for health is that oil consumption in Iran is higher than domestically recommended levels. Excessive intake, even of vegetable oils, contributes excess calories. MyPlate emphasizes consuming healthy oils (like liquid vegetable oils) in moderation instead of solid fats.
Sauces: Sauce consumption in Iran (approx. 4 kg annually) is roughly half the global average (approx. 7.8 kg). Given that many commercial sauces are high in sodium, sugar, and fat, this lower consumption might be viewed positively from a health perspective.
Salt (Sodium): Salt consumption in Iran is alarmingly high. Per capita intake (approx. 3 kg annually) is roughly double the global average (approx. 1.5 kg). This extremely high intake is a major contributor to hypertension and cardiovascular diseases in the country, directly contradicting global health guidelines and MyPlate’s message to compare sodium and choose lower-sodium options.
Sugar: Average sugar consumption in Iran (approx. 27 kg per person annually) is roughly half the global average (approx. 57 kg). While lower than the global figure, this is still a considerable amount, and aligns with MyPlate’s advice to reduce intake of added sugars.
7- Beverages Tea More Popular Than Coffee
While MyPlate specifically emphasizes drinking water and limiting sugary drinks, other beverages like tea and coffee are common components of daily intake globally, including in Iran. Foodex research examined the consumption of the three main hot beverages: tea, coffee, and herbal infusions.
Tea vs. Coffee Preference: Findings indicate that although coffee has a longer history in Iran, Iranians currently prefer tea over coffee.
Comparison with Global Average
Tea: Consumption in Iran is higher than the global average.
Coffee: Conversely, Iranians drink much less coffee than the global average.
This pattern reflects the strong cultural and social position of tea in Iran. From a nutritional perspective, high tea consumption implies potentially higher intake of its associated compounds (e.g., antioxidants, caffeine – requiring moderation awareness). Low coffee consumption means potentially missing out on benefits sometimes associated with moderate coffee intake.
Overall Picture of the Iranian Plate
Synthesizing the Foodex research data across all food groups provides a clearer image of the typical “Iranian food plate” compared to the “MyPlate” model. As accurately summarized previously:
The Iranian plate tends to have a larger share of Grains (predominantly refined) and Fruits (although overall fruit intake remains below recommended levels).
Conversely, the shares of Vegetables (lacking variety beyond onions and tomatoes) and Protein Foods (lacking variety beyond poultry, legumes, and nuts) are lower than recommended amounts.
Dairy consumption (with the exception of yogurt) is also below desirable levels.
Consumption of Oil (relative to domestic recommendations) and Salt is higher than optimal, while Sugar intake is lower than the global average.
This picture indicates that despite certain positive aspects, the typical Iranian dietary pattern requires significant adjustments and greater attention to achieve the balance and variety recommended by MyPlate for optimal health.
Conclusion A Mindful Plate for a Healthier Tomorrow
Our journey with MyPlate in this article – from understanding its history and rationale to delving into the five main food groups and key messages, and most importantly, comparing it with the realities of the Iranian food plate – has come to an end. We have seen that MyPlate is not just a simple image, but a clear and practical roadmap for achieving a more balanced and healthier diet in today’s busy life.
The analysis of Foodex research data showed us that although Iranian dietary patterns have unique and sometimes positive aspects (like high consumption of yogurt or nuts), significant challenges remain in key areas: insufficient intake of diverse vegetables and fruits, prioritizing refined grains over whole grains, lack of sufficient variety in protein sources, low dairy consumption, and unfortunately, high intake of oil and salt.
The good news is that changing these patterns, while requiring awareness and effort, is not impossible. Adopting the principles discussed throughout this article shows that through small and consistent steps, we can make significant differences in our health and that of our families. MyPlate serves as a powerful tool to guide these conscious changes.
At the same time, this analysis reveals valuable opportunities for the food and agriculture industry to innovate. By being responsible and focusing on consumer health, companies can develop and offer products that not only meet market needs but also contribute to improving the food culture and dietary patterns of the population – focusing on areas like whole grains, plant-based proteins, lower-sodium options, and healthier fats.
Foodex, as your analytical partner, is committed to providing knowledge, data, and deep insights to assist both consumers in making more informed choices and industry stakeholders in making more strategic decisions. We hope this comprehensive article is a step towards building a healthier food future.
For access to further analyses on healthy nutrition, food market insights, and the latest industry trends, you can always refer to the specialized sections of the Foodex journal.
Frequently Asked Questions FAQ
1- What exactly is MyPlate and how does it differ from the food pyramid?
MyPlate is a simple visual guide for healthy eating introduced by the U.S. Department of Agriculture (USDA) in 2011, replacing the previous food pyramid. It divides a dinner plate into 4 main sections – vegetables, fruits, grains (emphasizing whole grains), and lean protein foods – with a side serving representing dairy (low-fat). Its main goal is to provide an easy visual reminder for creating balanced meals regarding food group proportions. Its key differences from the pyramid are its visual simplicity, meal-time applicability, and stronger emphasis on fruits and vegetables.
2- Is MyPlate a diet?
No, MyPlate itself is not a specific diet plan (with daily meal plans or calorie targets). It is a flexible guideline or framework for promoting healthy and balanced eating habits over the long term. It emphasizes achieving the right proportions among food groups, rather than dictating exact amounts of specific foods.
3- Does using MyPlate cause weight loss?
Not necessarily. MyPlate is not inherently a weight loss program. However, following its principles (like filling half the plate with lower-calorie fruits and vegetables, choosing whole grains and lean proteins, and being mindful of portions) can support weight management or loss. This is because it generally encourages higher intake of fiber and nutrients, promoting satiety with potentially fewer calories. Nonetheless, ultimate weight loss depends on an individual’s overall calorie balance (intake vs. expenditure). For effective weight loss, controlling overall portion sizes and making smart, lower-calorie food choices within the MyPlate framework are essential. Consulting a nutrition professional for a personalized weight loss plan is recommended.
4- What is the newest/current nutritional guideline?
“MyPlate,” introduced by the USDA in 2011, is the current official nutritional guide promoted by that organization, replacing previous guides like MyPyramid and the Food Guide Pyramid. It is recognized in many countries as a simple and practical model for healthy eating. (Other guidelines, such as the Harvard Healthy Eating Plate, also exist).
Sogand Safari
Head of Content Marketing at Foodex Iran